ChartJs Integration with Django

ChartJs integration with Django
Step 1: Create Django project
1)Following is the command for creating django project:
$ django-admin startproject <Project Name>


Step 2: Create Application
1)Using following command we can create application:
$ django-admin startapp <Application Name>


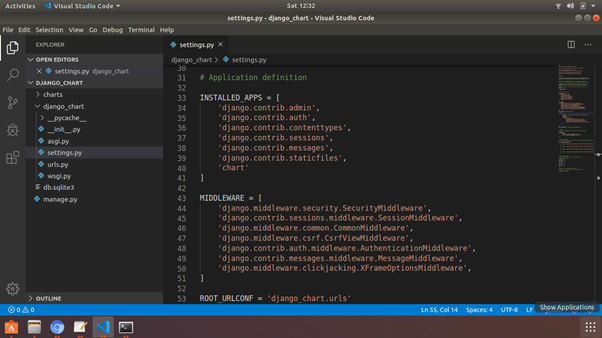
2)When we create django application, its compulsory to add that application name in 'INSTALLED_APPS' section in setting.py file which is present in our project folder.
Step 3: Running the Test Server
Let’s verify your Django project works, use following command:
$ python manage.py runserver
You will see the following output on the terminal:
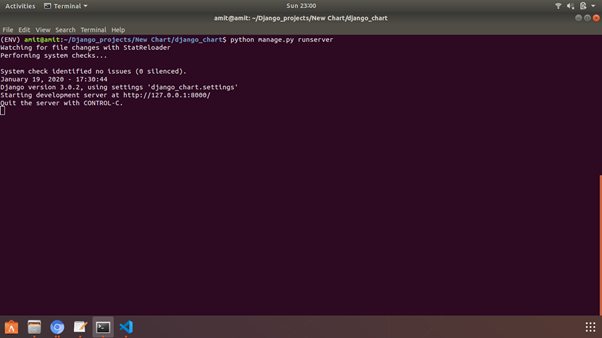
Now that the server’s running, visit http://127.0.0.1:8000/ with your Web browser. You’ll see a “Congratulations!” page, with a rocket taking off. It worked!
Step 4: Create Template
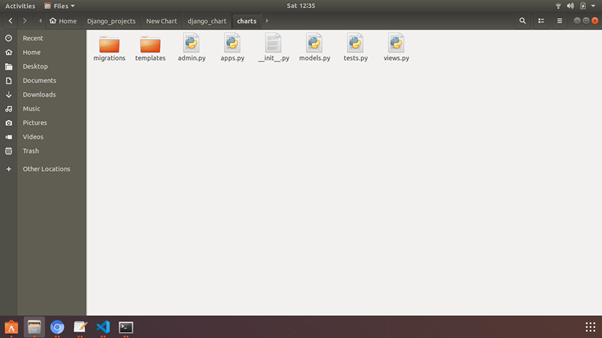
Create template folder in application folder
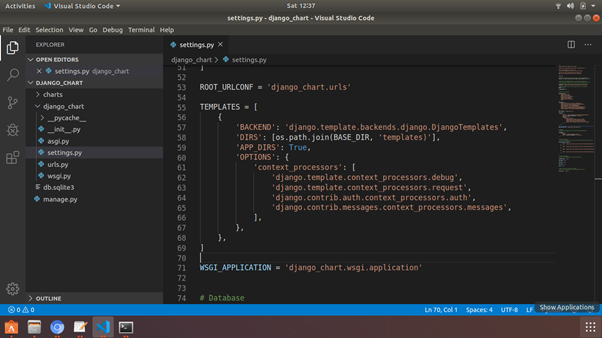
Django doesn’t know the path of template. To set the template path open setting.py file in our project folder and paste following path into the DIRS into the template section.
os.path.join(BASE_DIR, 'db.sqlite3'),
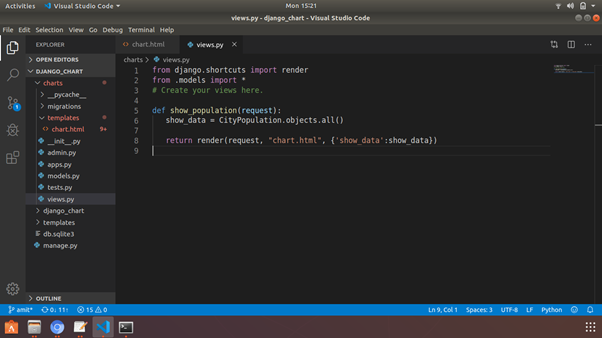
Step 5: Create model
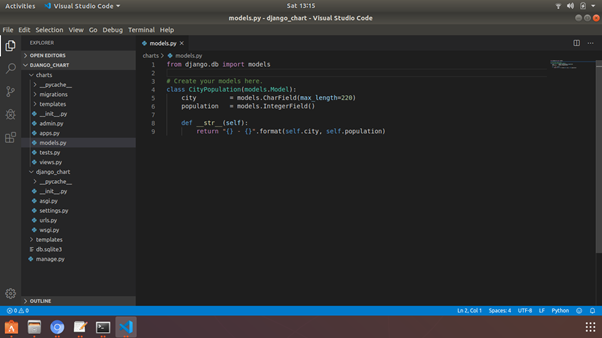
When we create project, we need to create simple model in models.py file of django project which contain data which is shown in our chart.
In the model first we need to create class CityPopulation which is inherit from models.Model
So, the first field or column in our database is 'city' which is CharField. The maximum length of that field we can set using 'max_length'
after that we add another field that is 'population'. This is integer type of field for that we use IntegerField.
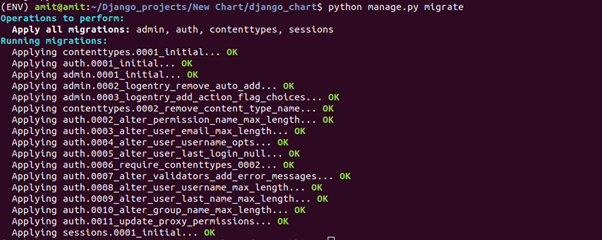
after creating model we make migrations for that we use following command
$ python manage.py makemigrations.

and then migrate the changes using migrate command
$ python manage.py migrate
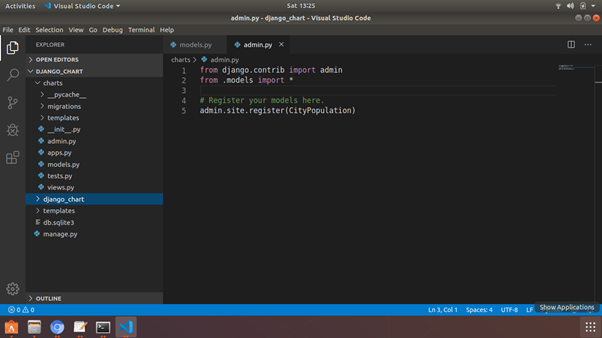
Step 6: Register model in admin.py
After creating model, register that model in admin.py file in the project folder, as shown in following picture.
Step 7: Create Function(view)
We can write your function or code part in views.py file in application folder.
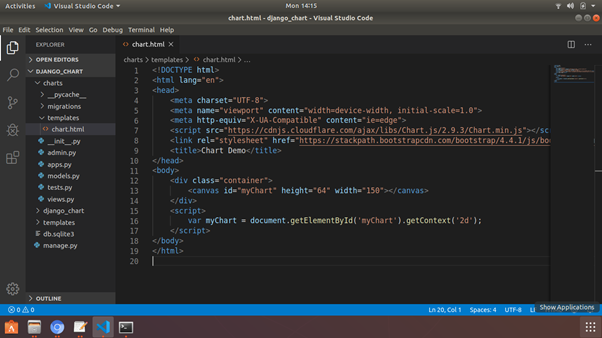
Step 8: Create Template
create chart.html file in template folder.
In that file type exclamation mark (!) and press Enter key. It gives basic html structure.
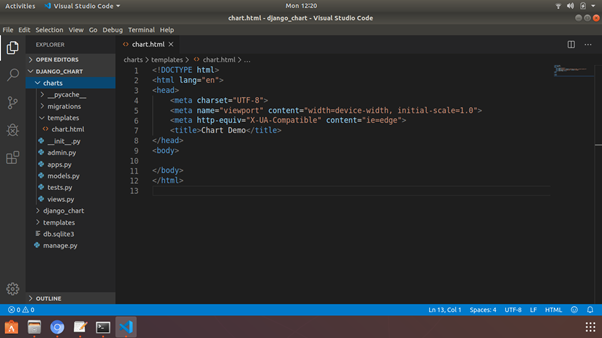
You can set your title using <title> tag.
Step 9: Set Home URL
To display home page, we need to set URL in ‘urls.py’ file in the project folder.
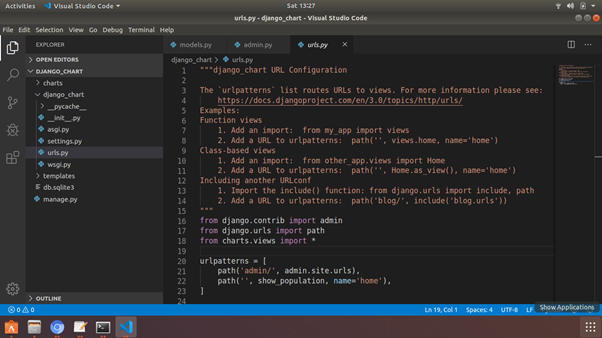
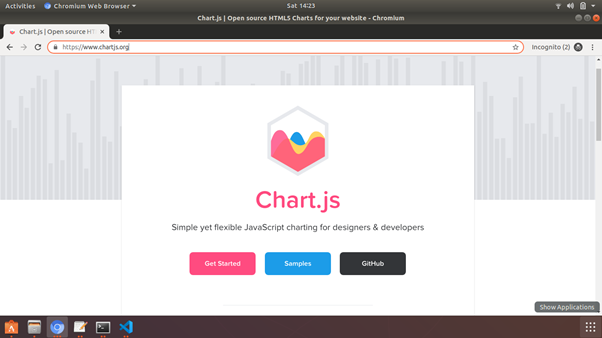
Chart.js is the JavaScript library which is used to show different 8 types of charts
To add that ChartJs CDN follow the following steps:
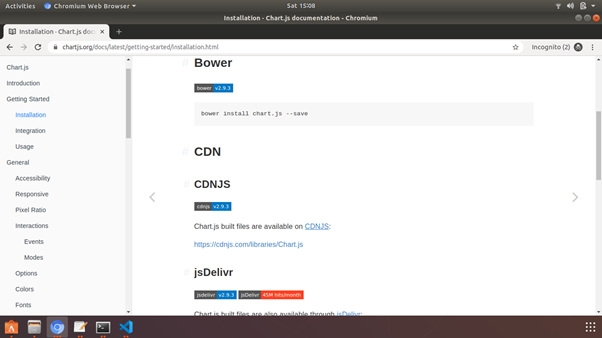
1)Just open www.chartjs.org and click to the 'Get started'. And then open installation page.
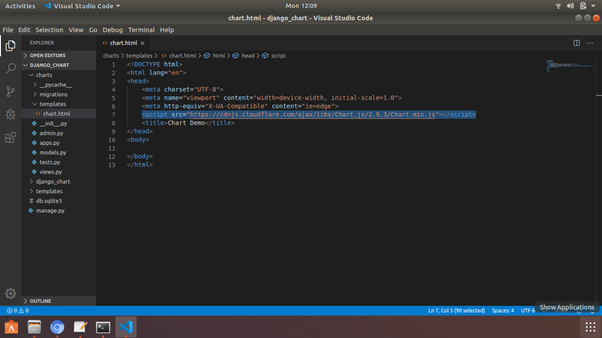
2)Click on 'https://cdnjs.com/libraries/Chart.js' link and copy CDN that is 'https://cdnjs.cloudflare.com/ajax/libs/Chart.js/2.9.3/Chart.min.js' and paste it on chart.html file under the <head> tag section using <script> tag.
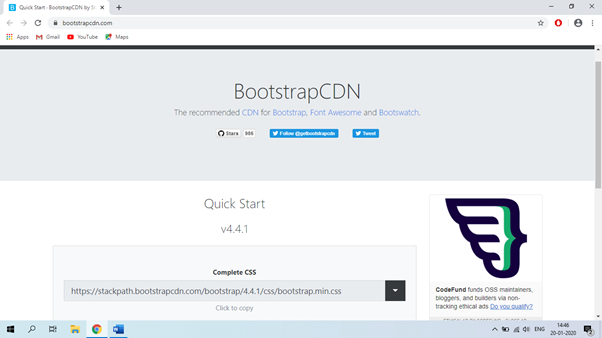
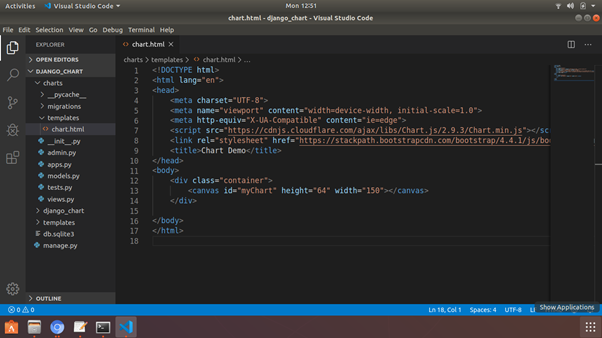
3)For bootstrap CDN open 'https://www.bootstrapcdn.com/' and copy the link below the Complete CSS that is 'https://stackpath.bootstrapcdn.com/bootstrap/4.4.1/css/bootstrap.min.css' and paste it in <link> tag under the <head> section.
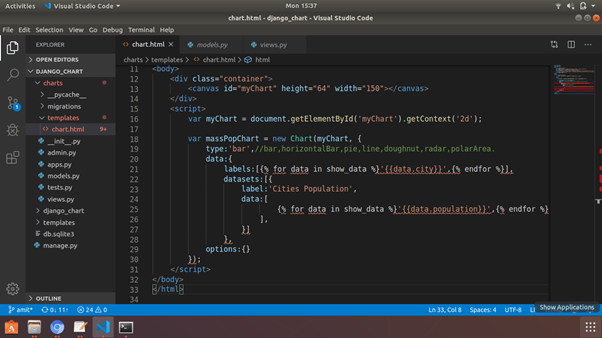
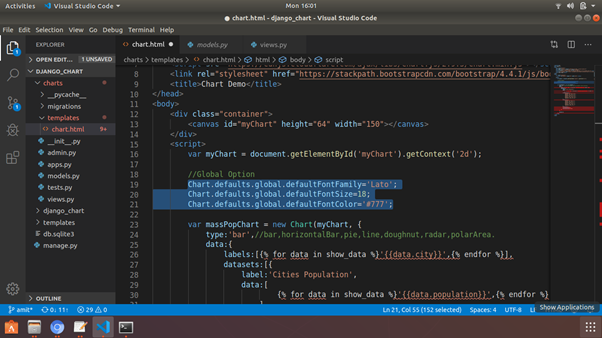
We have added charjs, now in <body> section we need to create <div> with the class 'container'.
and in that <div> we create element and give id to that. We can also set the height and width in that <canvas>.
After that everything we will be done in java script that’s why we can add <script> tag and write in between that tag.
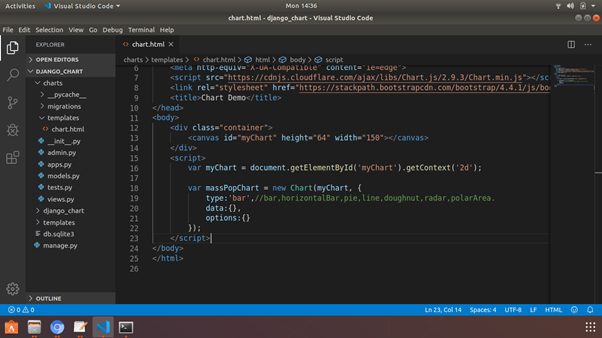
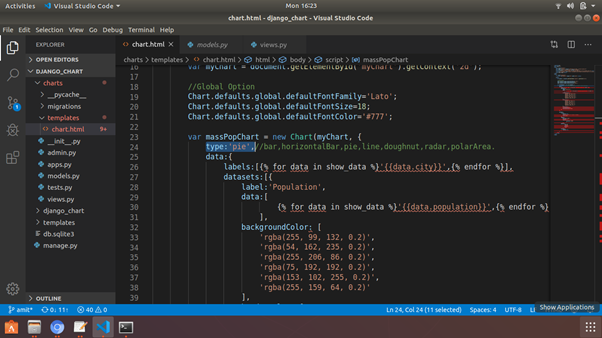
In that we need to create variable for our chart and get element id that is 'myChart'.
Then create variable 'massPopChart' and we want set up new object in that. We set parameter that is 'myChart' and also set second parameter that is an object and this is where all the properties, data, etc exist.
type: Type of chart include bar, horizontalBar, pie, line, doughnut, radar and polar Area.
data: In the data there are labels and datasets.
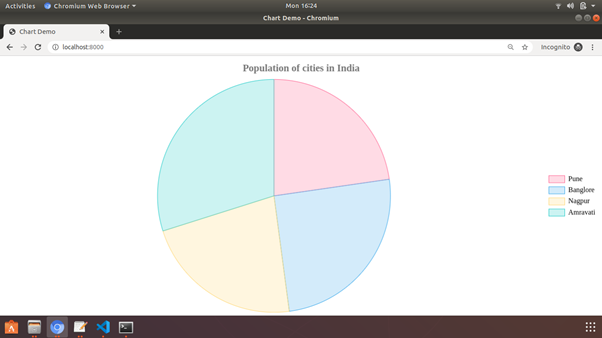
Screen will look like after set type, data and options.
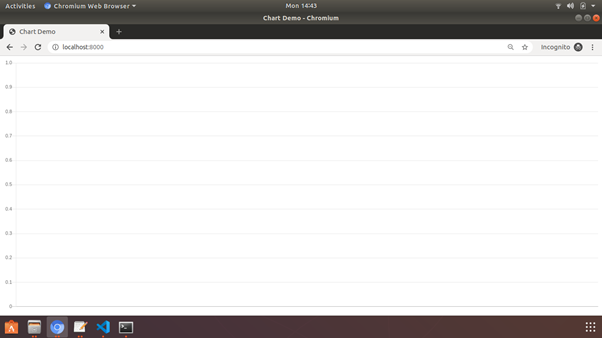
Once you run python server, you will see the following screen −

Then add labels and dataset in data.
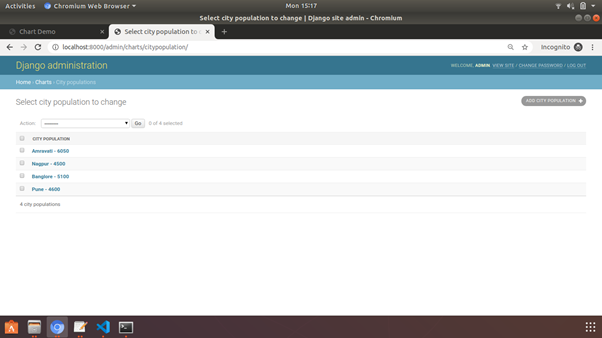
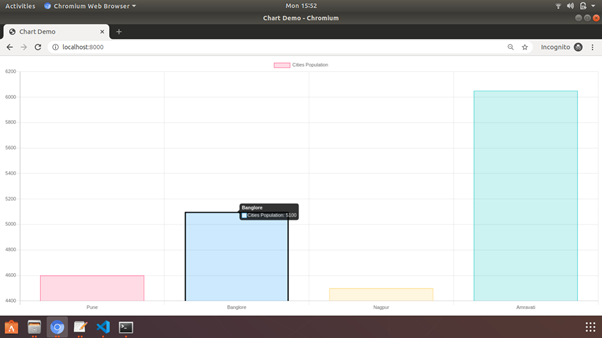
In this project we can show the city and their population thats why we add cities and their population data in database using Django administration.
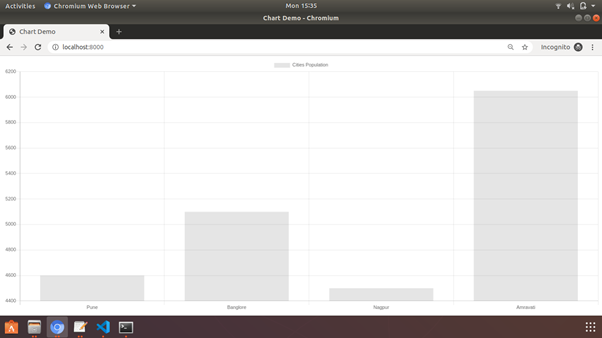
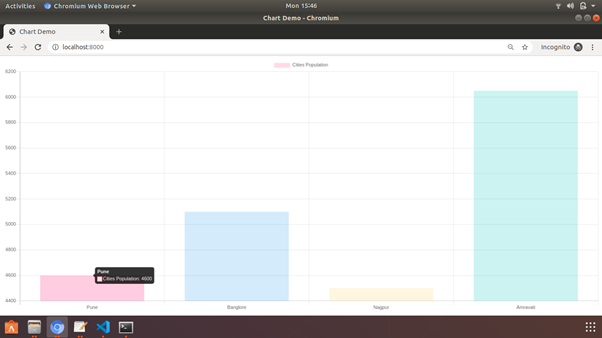
To show cities in chart, add cities dynamically in 'labels' and for population, add it dynamically in 'data' as shown in the following screen.
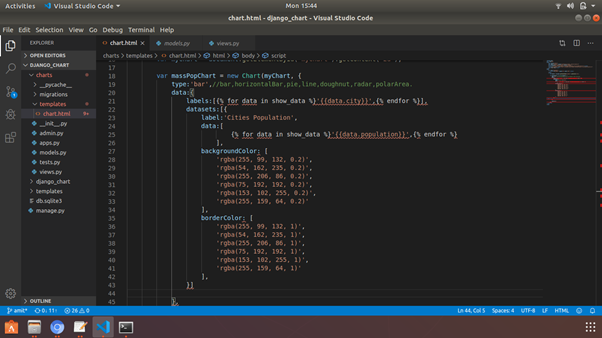
We can add background color in the chart, for that we use 'backgroundColor'
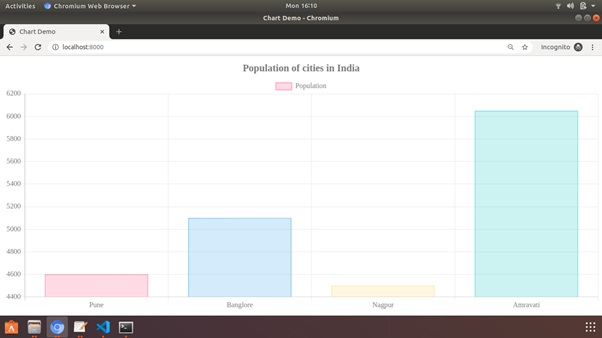
After adding background color chart will look like
we can also set the border width, border color, hover border width and hover border color as shown in screen.
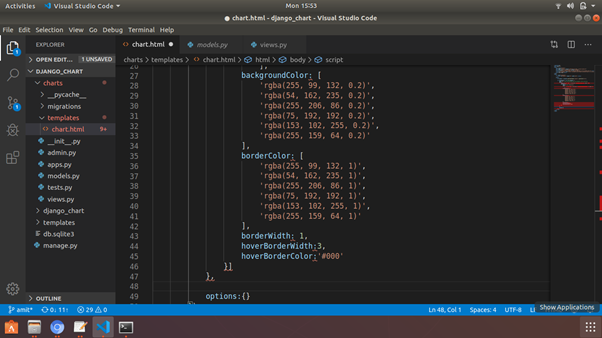
After adding borderColor, hoverBorderWidth and hoverBorderColor
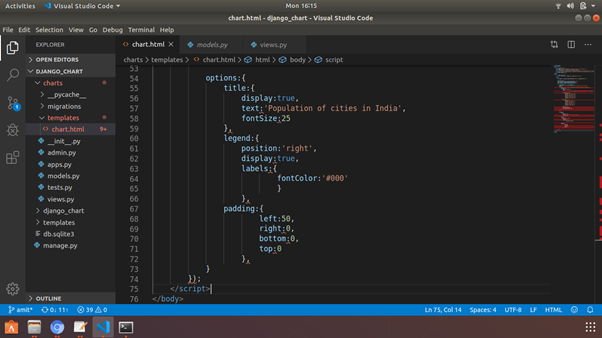
For set font size, font family and font color globally add following options
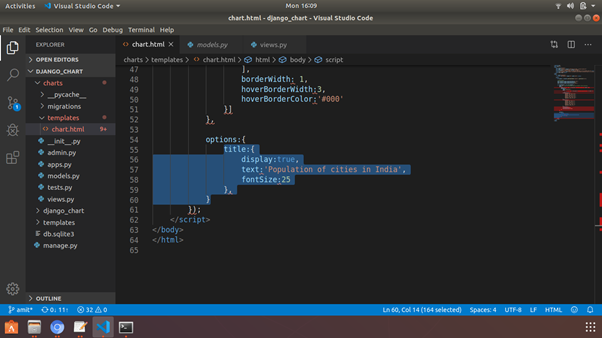
In option we can set
1) title: {
display: true,
text: 'Population of cities in India'
fontSize:25
}
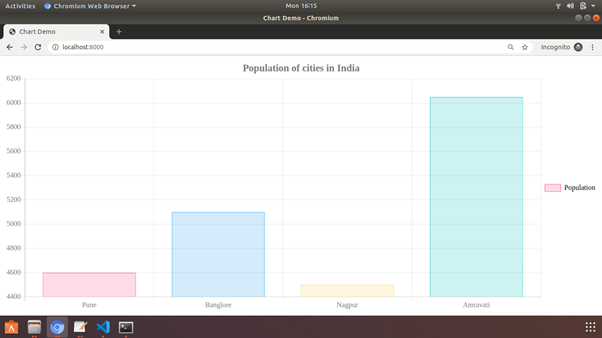
2) legend: {
Position: 'right',
Display: true,
labels: {
fontColor: '#000'
}
},
3) padding: {
left:50,
right:0,
bottom:0,
top:0
},
4) tooltips: {
enebled:true,
}
If you want to see another chart then change chart type
After changing chart type ‘bar’ to ‘pie’