Pandas Real time Case Study using Retail data-sets

Introduction
Content
You are provided with historical sales data for 45 stores located in different regions - each store contains a number of departments. The company also runs several promotional markdown events throughout the year. These markdowns precede prominent holidays, the four largest of which are the Super Bowl, Labor Day, Thanksgiving, and Christmas. The weeks including these holidays are weighted five times higher in the evaluation than non-holiday weeks.
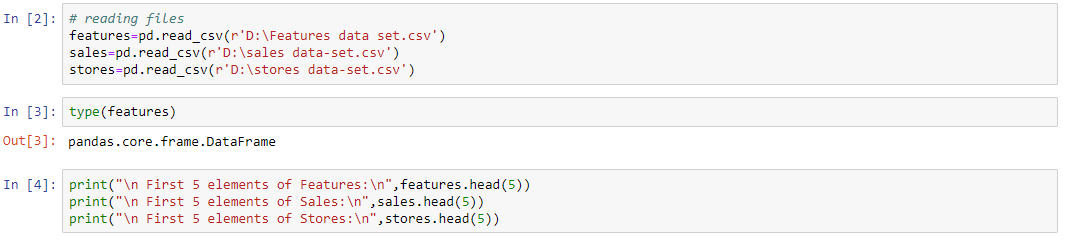
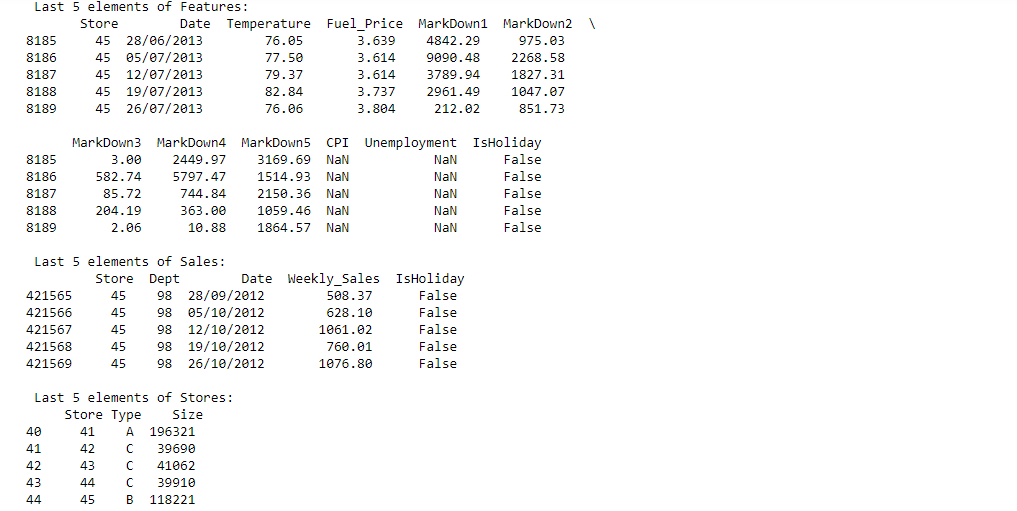
Within the Excel Sheet, there are 3 Tabs – Stores, Features and Sales
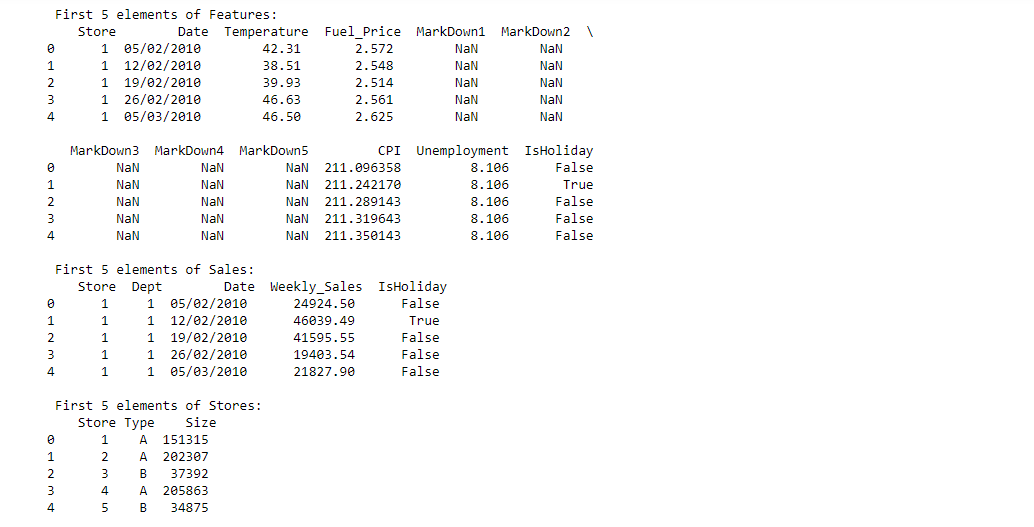
Stores
Anonymized information about the 45 stores, indicating the type and size of store
Features
Contains additional data related to the store, department, and regional activity for the given dates.
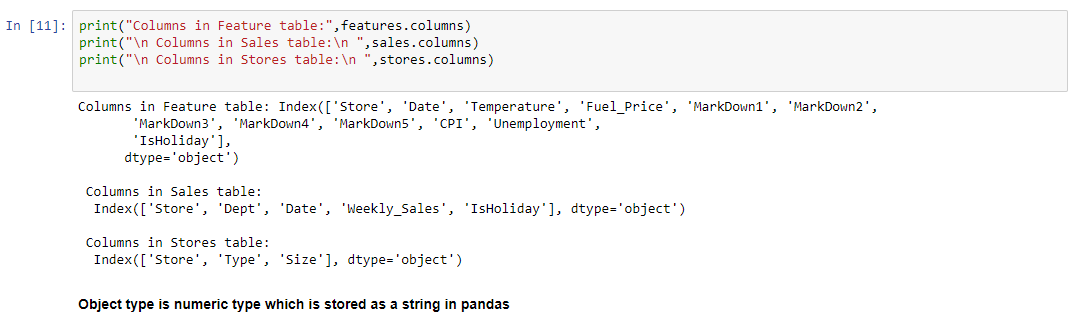
- Store - the store number
- Date - the week
- Temperature - average temperature in the region
- Fuel_Price - cost of fuel in the region
- MarkDown1-5 - anonymized data related to promotional markdowns. MarkDown data is only available after Nov 2011, and is not available for all stores all the time. Any missing value is marked with an NA
- CPI - the consumer price index
- Unemployment - the unemployment rate
- IsHoliday - whether the week is a special holiday week
Sales
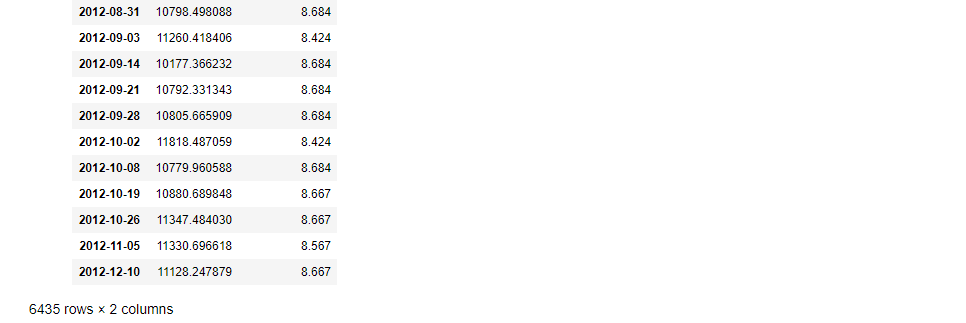
Historical sales data, which covers to 2010-02-05 to 2012-11-01. Within this tab you will find the following fields:
- Store - the store number
- Dept - the department number
- Date - the week
- Weekly_Sales - sales for the given department in the given store
- IsHoliday - whether the week is a special holiday week
Objectives
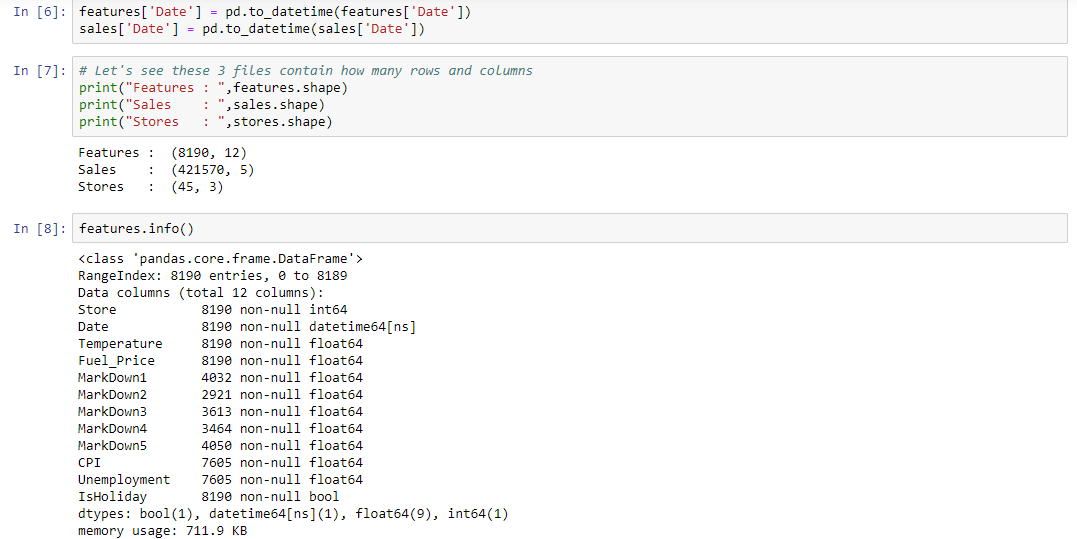
- Diagnose data for cleaning
- Merge the data in a unique DataFrame
- Subsetting
- Grouped calculations
- Visualization
- Correlation
- Calculating the Pearson Correlation
- Kendall Rank Correlation
- Kendall Rank Correlation Using .corr()
- Visualize using a Heat-map
- Outlier
- Detecting outlier using Z score
- InterQuantile Range

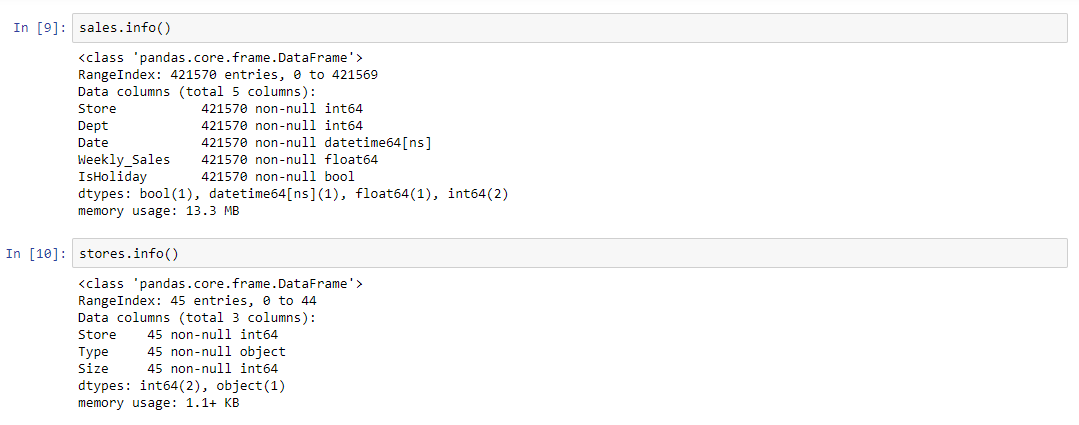
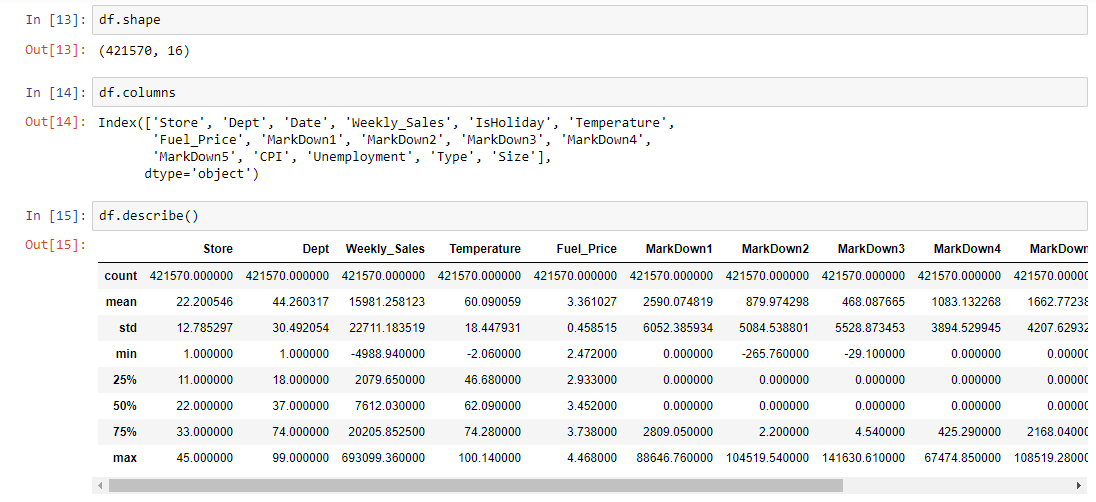
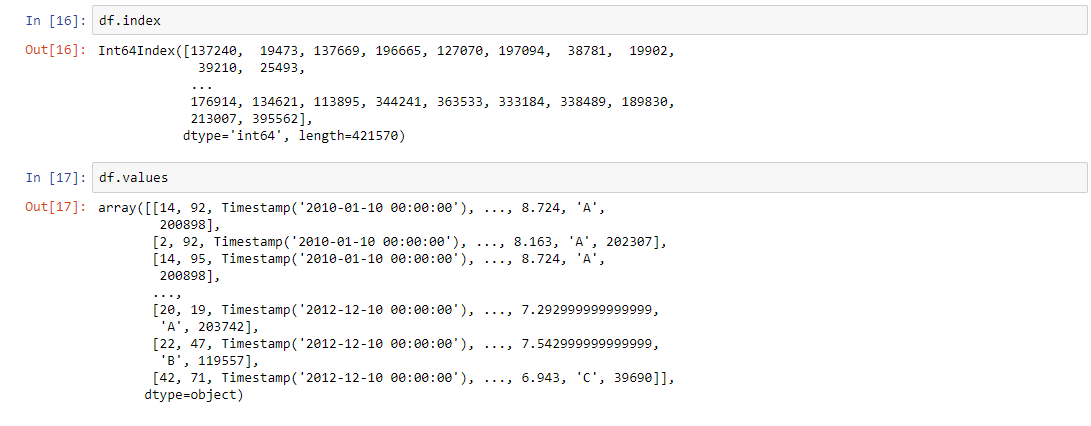
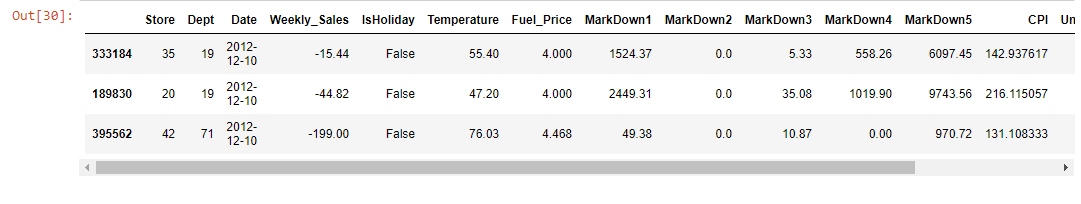
Diagnose data for cleaning

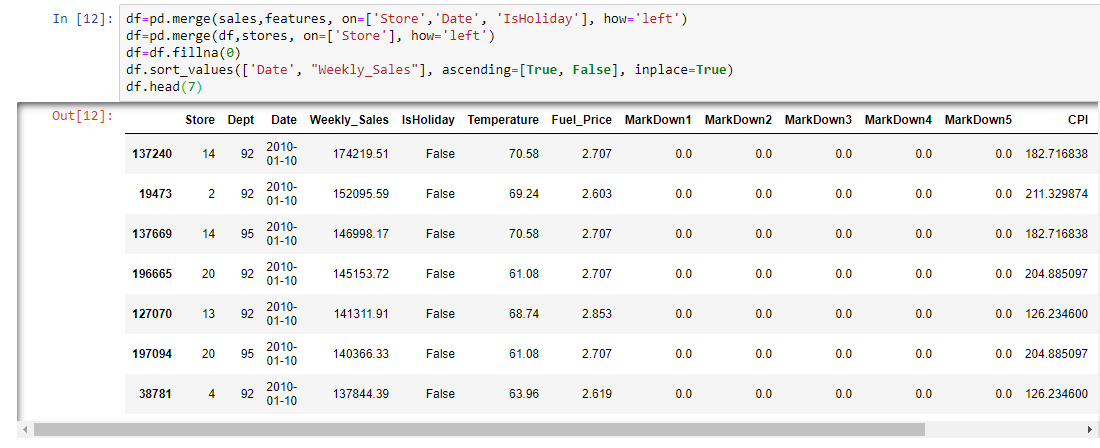
Merge the data in a unique DataFrame
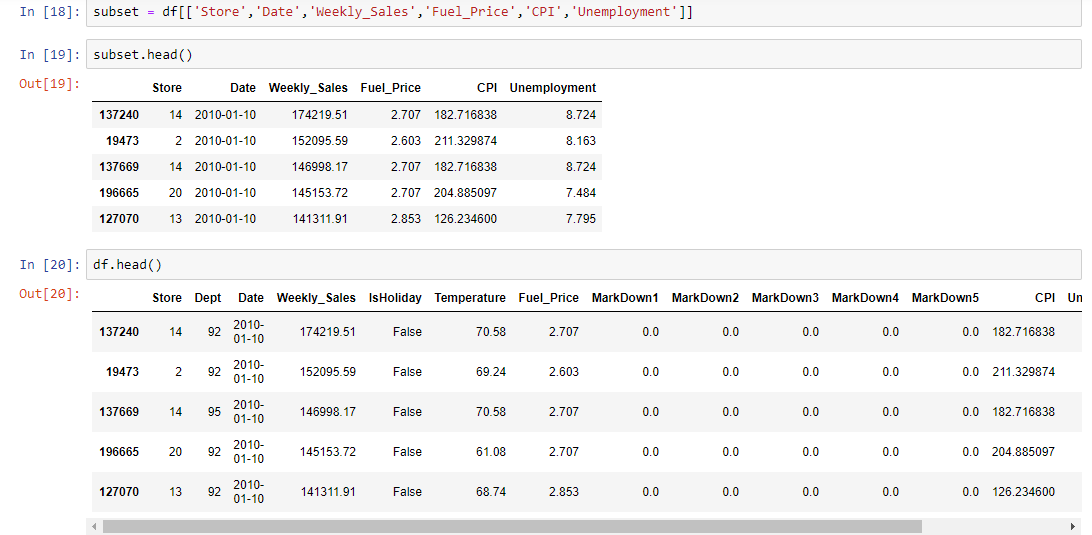
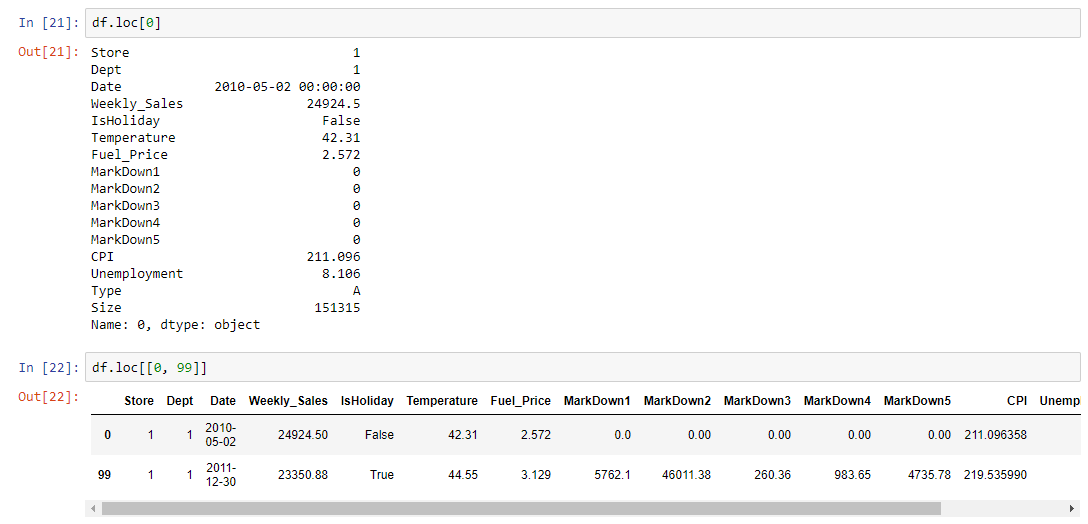
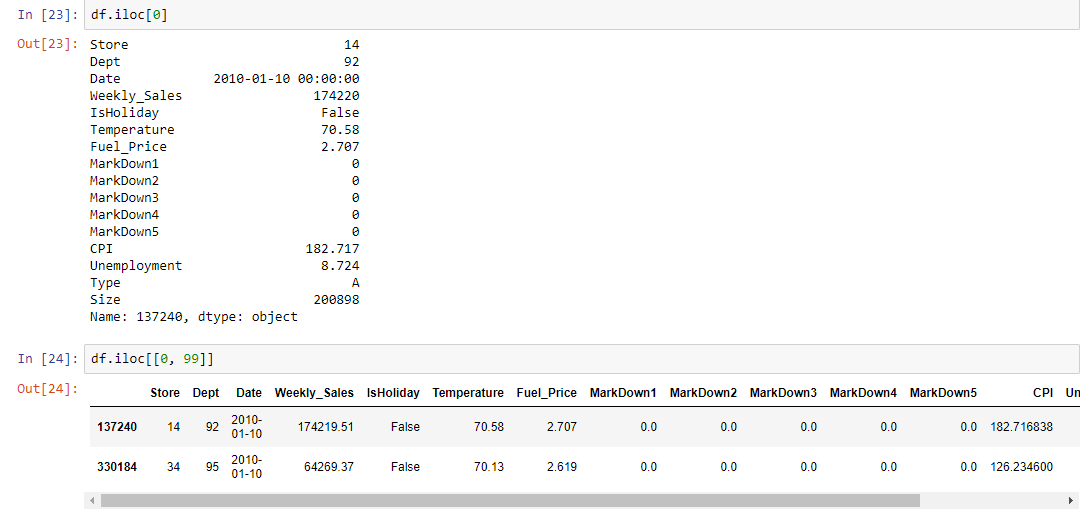
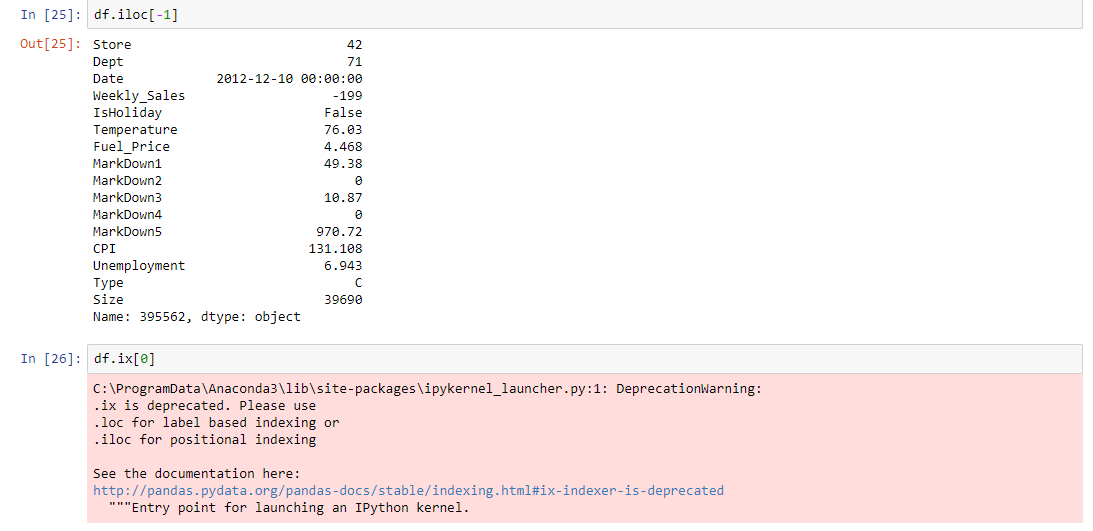
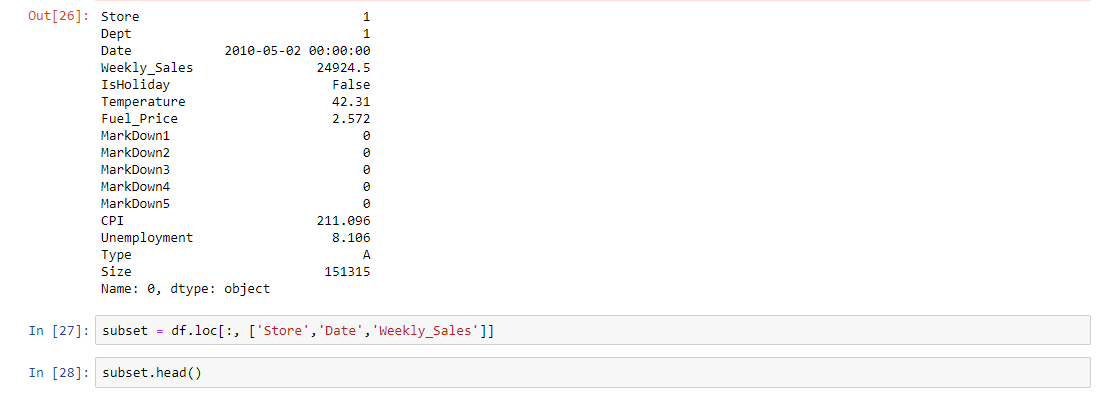
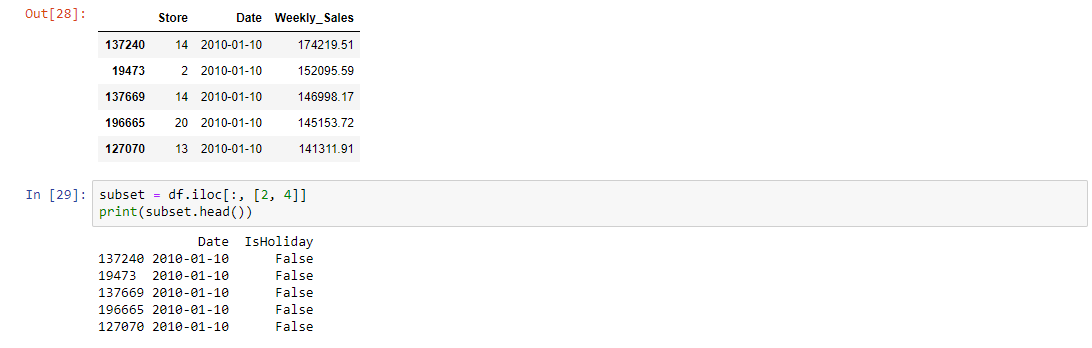
Subsetting

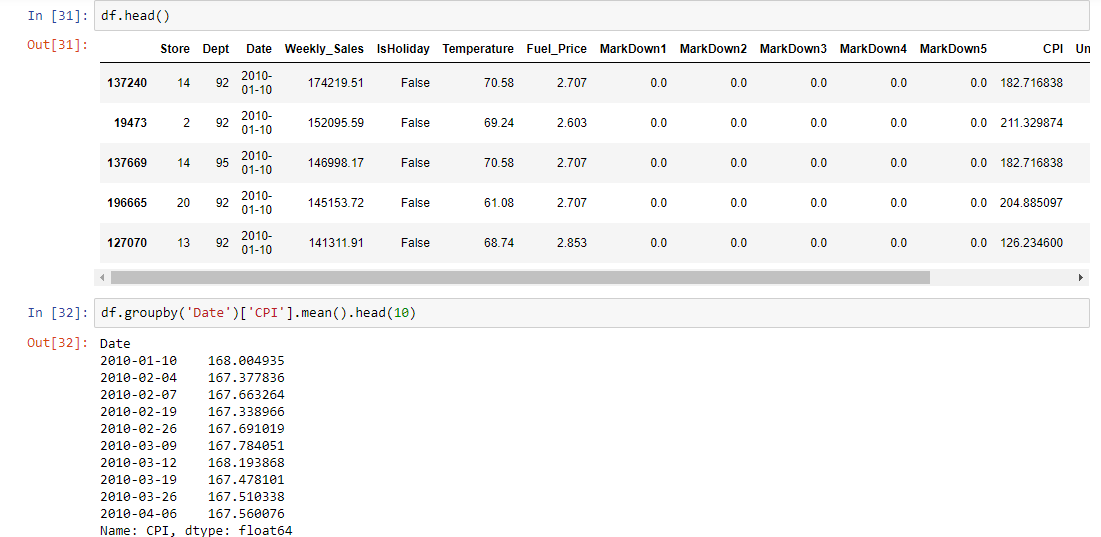
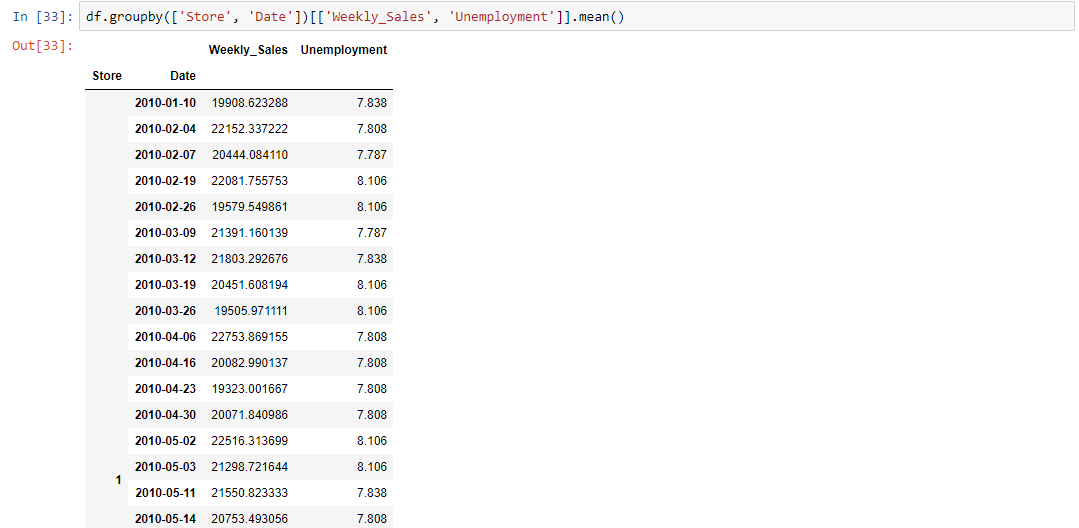
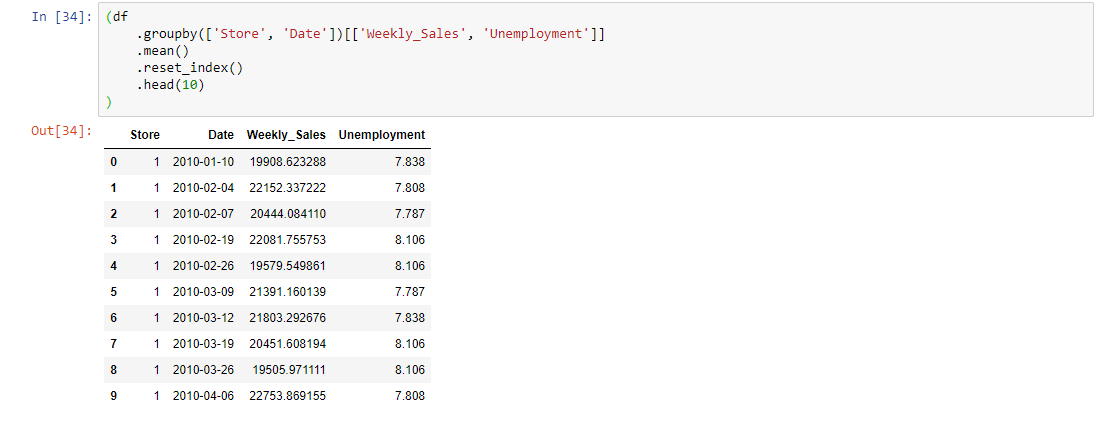
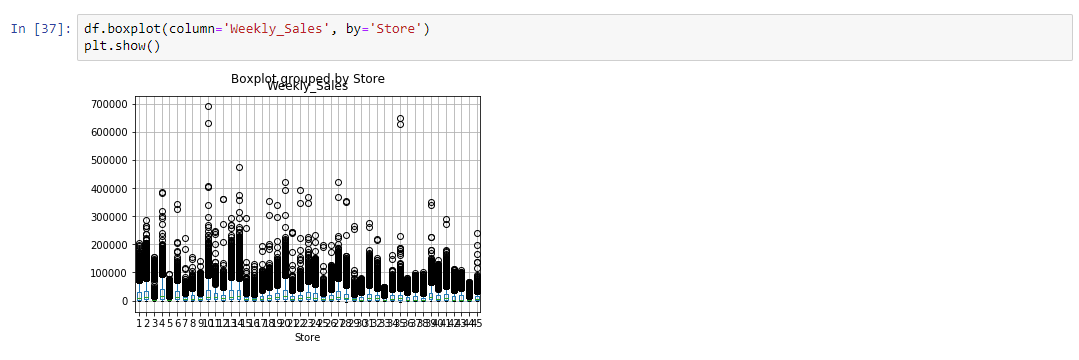
Grouped calculations

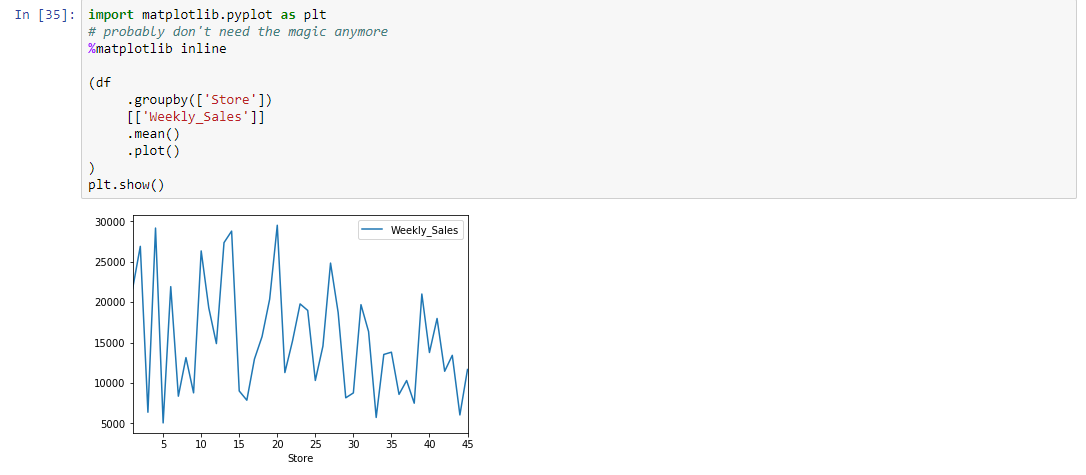
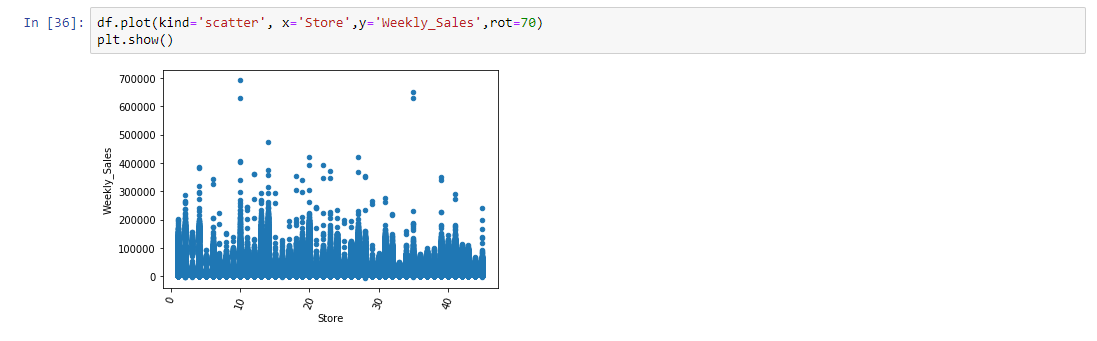
Visualization
Correlation
The term "correlation" refers to a mutual relationship or association between quantities. In almost any business, it is useful to express one quantity in terms of its relationship with others. For example, sales might increase when the marketing department spends more on TV advertisements, or a customer's average purchase amount on an e-commerce website might depend on a number of factors related to that customer. Often, correlation is the first step to understanding these relationships and subsequently building better business and statistical models.
So, why is correlation a useful metric?
- Correlation can help in predicting one quantity from another
- Correlation can (but often does not, as we will see in some examples below) indicate the presence of a causal relationship
- Correlation is used as a basic quantity and foundation for many other modeling techniques
More formally, correlation is a statistical measure that describes the association between random variables. There are several methods for calculating the correlation coefficient, each measuring different types of strength of association. Below we summarize three of the most widely used methods.
Calculating the Pearson Correlation
We’ll use method = ‘pearson’ for the dataframe.corr since we want to calculate the pearson coefficient of correlation. Then we’ll print it out!
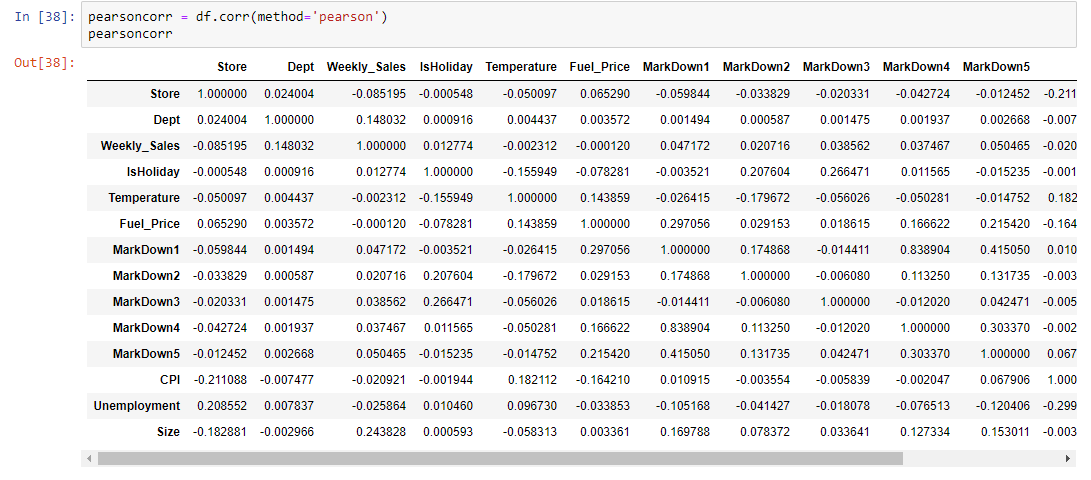
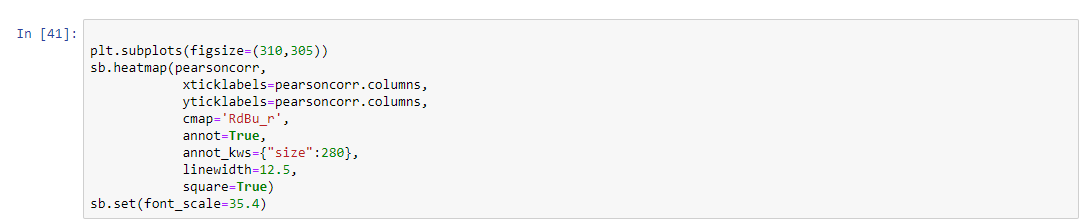
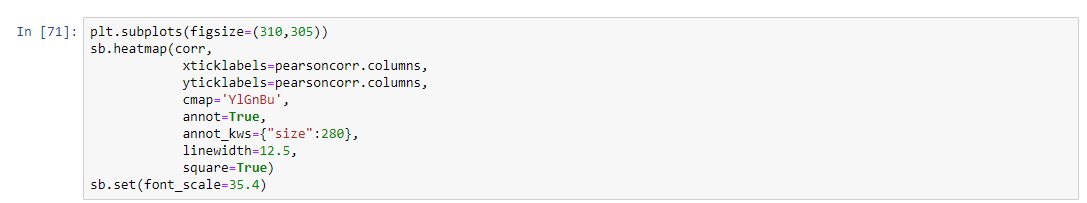
This is nice to have, but having a large number of variables in the data will quickly make this more time consuming to interpret. This is the reason I imported the seaborn package in pandas:

Quick Description — Seaborn is a python library for visualizing data. It is built on top of matplotlib and closely integrated with pandas data structures. To make this look beautiful and easier to interpret, add this after calculating the Pearson coefficient of correlation.
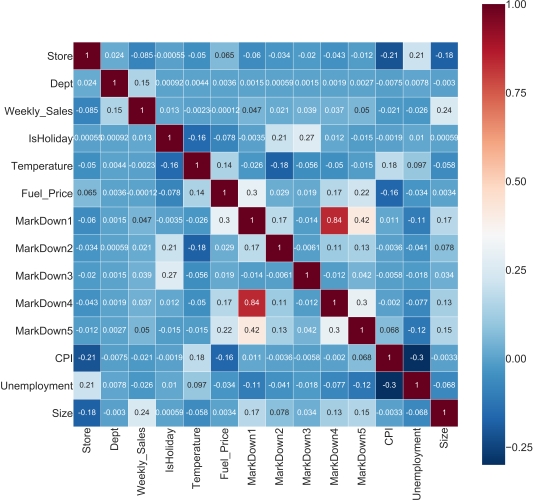
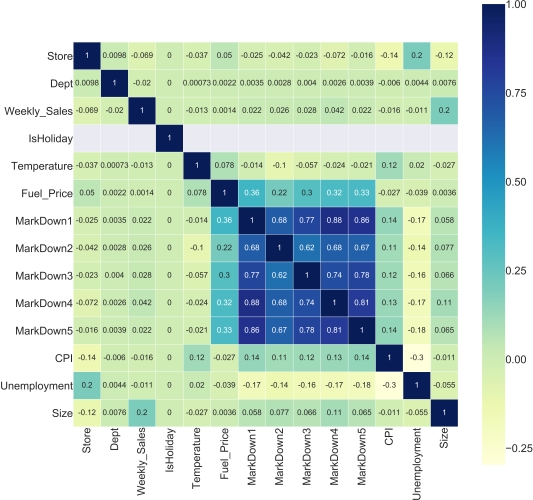
A co-efficient close to 1 means that there’s a very strong positive correlation between the two variables. In our case, the maroon shows very strong correlations. The diagonal line is the correlation of the variables to themselves — so they’ll obviously be 1.
Kendall Rank Correlation
Kendall rank correlation (non-parametric) is an alternative to Pearson’s correlation (parametric) when the data you’re working with has failed one or more assumptions of the test. This is also the best alternative to Spearman correlation (non-parametric) when your sample size is small and has many tied ranks.
Kendall rank correlation is used to test the similarities in the ordering of data when it is ranked by quantities. Other types of correlation coefficients use the observations as the basis of the correlation, Kendall’s correlation coefficient uses pairs of observations and determines the strength of association based on the patter on concordance and discordance between the pairs.
-
Concordant: Ordered in the same way (consistency). A pair of observations is considered concordant if (x2 — x1) and (y2 — y1) have the same sign.
-
Discordant: Ordered differently (inconsistency). A pair of observations is considered concordant if (x2 — x1) and (y2 — y1) have opposite signs.

Kendall Rank Correlation Using .corr()
Pandas dataframe.corr() is used to find the pairwise correlation of all columns in the dataframe. If you need a quick intro on this — check out my explanation of dataframe.corr().

Visualize using a Heat-map
Outlier
An outlier is a data point in a data set that is distant from all other observations. A data point that lies outside the overall distribution of the dataset.
What are the criteria to identify an outlier?
-
Data point that falls outside od 1.5 times of an interquartile range above the 3rd quartile and below the 1st quartile
-
Data point that falls outside of 3 standard deviations, we can usee a z-score & if the z-score falls outside of 2 standard deviation.
What is the reason for an outlier to exists in a dataset?
- Variablitity in the data
- An experimental measurement error.
I have taken one column of dataframe Unemployment to detect the outlier, So let's start
Detecting outlier using Z score
Using Z score Formula for Zscore = (Observation-Mean)/Standard Deviation
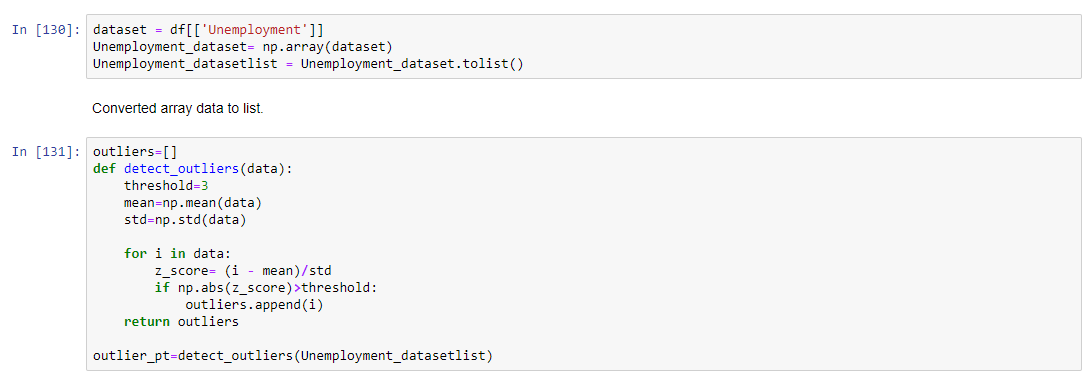
Threshold value i am keeping it as 3 because within 3rd standard deviation if data is falling away then i'm going to consider as a outlier
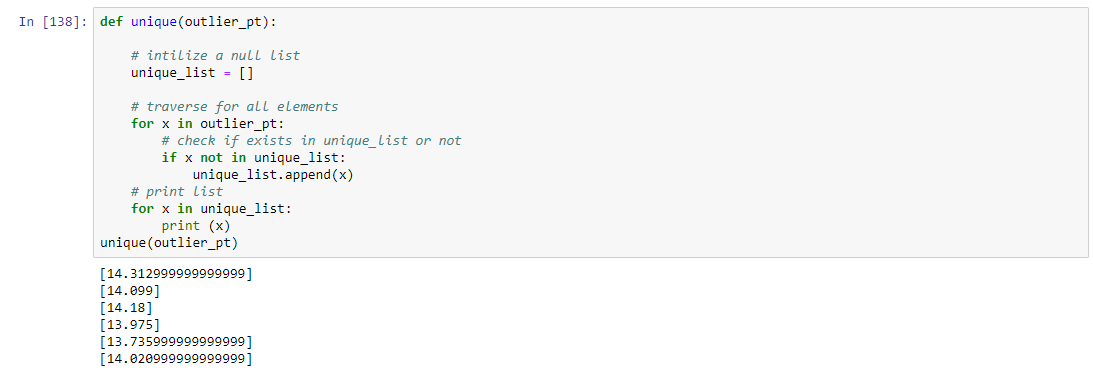
Applied unique function because we don't want the repeated data.
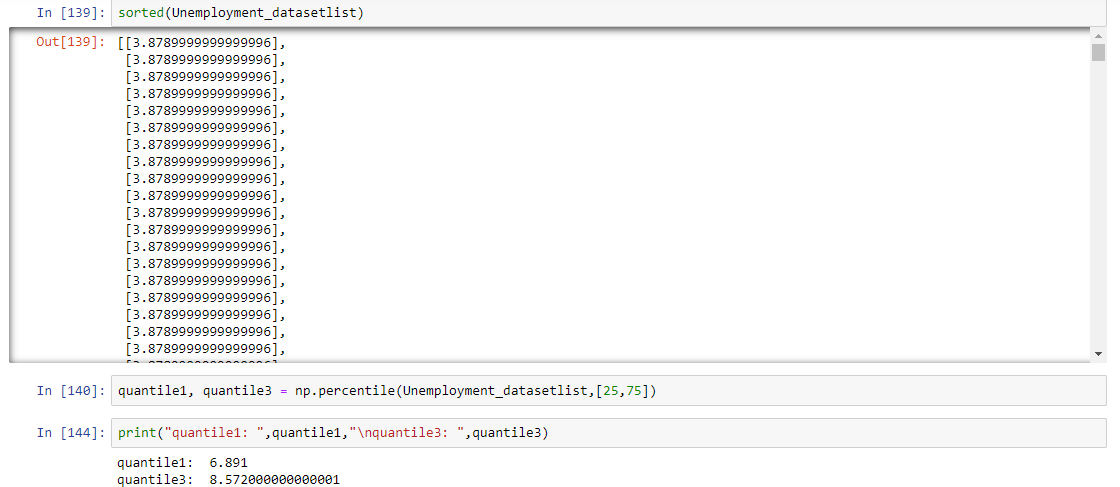
InterQuantile Range
75%,25% values in a dataset
Steps
-
Arrange the data in increasing order
-
Calculate first(q1) and third quartile(q3)
-
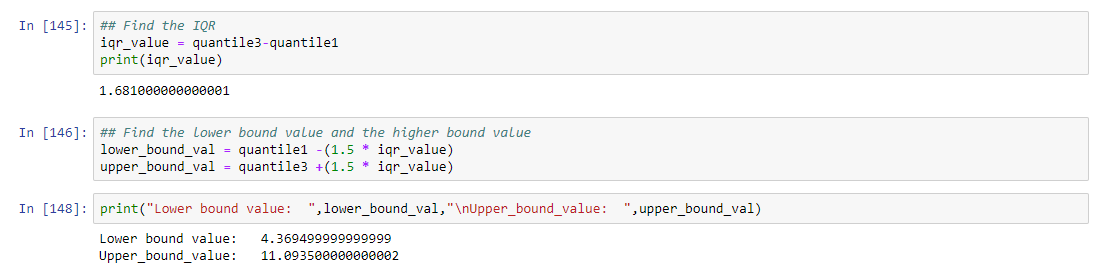
Find interquartile range(q3-q1)
-
Find lower bound q1*1.5
-
Find upper bound q3*1.5
Anything that lies outside of lower and upper bound is an outlier